1. INTRODUCTION
Entrepreneurship is a critical driver of economic growth, employment, and innovation. The Startup India initiative, launched in 2016, aims to create a supportive ecosystem through regulatory simplification, financial incentives, and institutional support. Key achievements (FY17–FY26) are 2.23 lakh startups recognized, 23.36 lakh jobs created, Record of 55,200 startups in FY26 and Significant expansion in credit guarantee and funding mechanisms This study evaluates the initiative using business analytics techniques, offering a data-driven perspective on policy effectiveness. YoY Growths in Startups FY26 Vs FY25 is 51.6%. Under Expansion of Credit Guarantee for Startups (CGSS) coverage Enhanced from Rs.10 cr to Rs.20 cr. Guarantee fee for Champion Sectors reduced to 1%. Loans worth more than Rs.600 crore guaranteed in FY 26 ie, 2X YOY Growth under CGSS in FY26. Record Number of Startups in FY 26 is 55200 Startups recognised- highest in a single year.
2. Literature Survey
The Global Studies and India Focused Studies are given in table 1.
| Table 1: Global Studies and India Focused Studies | ||
| Global Studies | ||
| Author | Year | Findings |
| Acs et al. | 2017 | Entrepreneurship drives economic competitiveness |
| Audretsch & Belitski | 2020 | Institutional frameworks enhance startup ecosystems |
| OECD | 2021 | Policy support is critical for SME scalability |
| India-Focused Studies | ||
| DPIIT Reports | 2023–2026 | Rapid growth in startup recognition |
| NASSCOM | 2022 | India as a leading startup hub |
| Startup Genome | 2023 | Strong ecosystem maturity |
Source: Various publications.
Research Gap: Limited use of business analytics frameworks, Lack of predictive and prescriptive insights and Insufficient integration of policy-performance analytics.
3. Materials and Methods
Conceptual Framework is given in Table 2.
| Table 2: Conceptual Framework | ||
| Inputs Variables | Analytical Framework | Outputs Variables |
| Descriptive Analytics | ||
| Diagnostic Analytics | ||
| Investment (Fund of Funds) (Icr) | Correlation Analysis | Startup count (Sun) |
| Credit support (CGSS) | Regression Analysis | Employment generation (En) |
| Policy interventions | Inferential Analysis | Patent filings (Ipn) |
| Predictive Modelling | Procurement value (Pcr) | |
| Prescriptive Analytics | ||
| Decision Analysis | ||
Source: Developed by Researcher (Secondary data (DPIIT, FY17–FY26))
4. Results and Discussion
4.1 Descriptive Analytics
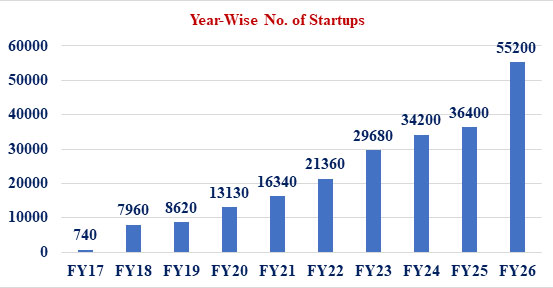
Startups (Sun) grew from 740 (FY17) ? 55,200 (FY26) (Tt), Growth rate FY26 vs FY25: 51.6%, Employment increased from 3.6 ? 4.9 lakh and Patent filings increased by 57%.
These data indicate exponential ecosystem expansion. The yearwise no. of startups are given in figure 2.
Source: DPIIT, Government of India.
Figure 2: Year-wise no. of Startups
The Descriptive Analysis is given in Figure 3 and Table 3.
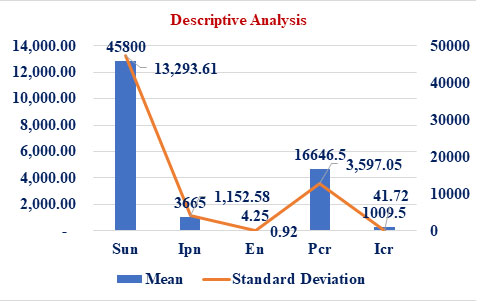
Source: Computed data.
Figure 3: Descriptive Analysis
| Table 3: Descriptive Analysis | |||||
| Sun | Ipn | En | Pcr | Icr | |
| Mean | 45800 | 3665 | 4.25 | 16646.5 | 1009.5 |
| Standard Error | 9400 | 815 | 0.65 | 2543.5 | 29.5 |
| Median | 45800 | 3665 | 4.25 | 16646.5 | 1009.5 |
| Standard Deviation | 13293.607 | 1152.58 | 0.91924 | 3597.0522 | 41.7193 |
| Sample Variance | 176720000 | 1328450 | 0.845 | 12938785 | 1740.5 |
| Range | 18800 | 1630 | 1.3 | 5087 | 59 |
| Minimum | 36400 | 2850 | 3.6 | 14103 | 980 |
| Maximum | 55200 | 4480 | 4.9 | 19190 | 1039 |
| Sum | 91600 | 7330 | 8.5 | 33293 | 2019 |
| Count | 2 | 2 | 2 | 2 | 2 |
Source: Computed data.
4.2 Diagnostic Analytics
Why growth occurred is due to Expansion of CGSS (?10 Cr ? ?20 Cr), Increase in public procurement and Improved funding access (FFS). Policy interventions are the primary drivers.
4.3 Correlation Analysis (Conceptual)
Correlation Analysis is given in Table 4 and 5.
| Table 4: Correlation Analysis | ||||||
| Sun | Ipn | En | Pcr | Icr | Tt | |
| Sun | 1.00 | |||||
| Ipn | 1.00 | 1.00 | ||||
| En | 1.00 | 1.00 | 1.00 | |||
| Pcr | 1.00 | 1.00 | 1.00 | 1.00 | ||
| Icr | 1.00 | 1.00 | 1.00 | 1.00 | 1.00 | |
| Tt | 0.97 | 1.00 | 1.00 | 1.00 | 1.00 | 1.00 |
Source: Computed data.
Strong positive relationships in table 5, Indicates innovation and funding are interlinked
| Table 5: Correlation Analysis Results | |
| Variable Pair | Relationship |
| Investment ? Startups | Strong positive |
| Procurement ? Employment | Strong positive |
| Patents ? Startups | Moderate to strong |
Source: Computed data.
4.4 Regression Analysis
The regression equation Model is given in equation [1] and [2],
Sun = ß0 + ß1 Tt + ? ……….[1]
Sun = -6696.67 + 5283.58 Tt….[2]
Results: ß1 ˜ 5283 startups/year, R² ˜ 0.94, p= 0.00 < 0.05-Significant
4.5 Inferential Analysis
Significant difference between FY25 and FY26 across: Employment, Patents and Procurement. Suggests statistically meaningful policy impact.
4.6 Predictive Analytics
Forecast (Trend-based): Predictive Analysis is given in figure 4.
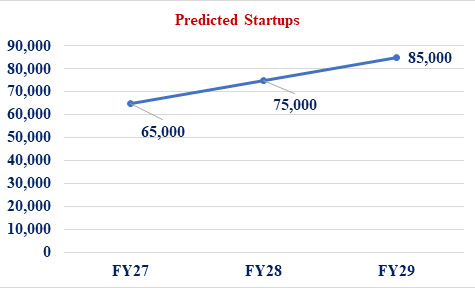
Source: Computed data.
Figure 4: Predictive Analysis
India is moving toward global startup leadership
Statewide No. of Startups are given in Figure 5 where Maharastra ranks no.1, Karnataka ranks no.2, Uttar Pradesh ranks no.3, Delhi ranks No.4, Gujarat ranks no.5, Tamil Nadu ranks no.6, Telegana ranks no.7, Haryana ranks no 8, Kerala ranks no.9 and Rajasthan ranks no.10.
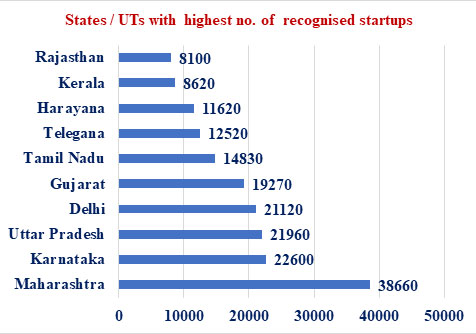
Source: DPIIT, Government of India.
Figure 5: Statewide No. of Startups
Figure 6 gives No of Patents increase from 2850 to 4480 with CAGR of 57.19%.
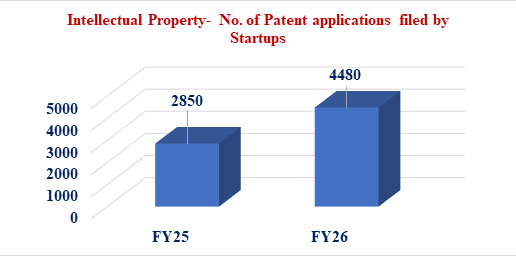
Source: DPIIT, Government of India.
Figure 6: No of Patents
Figure 7 gives Employment Generation increase from 3.6 lakh to 4.9 lakh with CAGR of 36.11%.
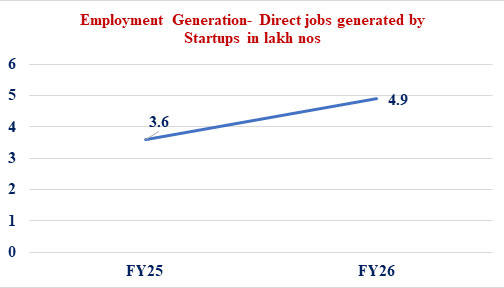
Source: DPIIT, Government of India.
Figure 7: Employment Generation
Figure 8 reveals Public Procurement increase from Rs.14,103 crore to Rs.19,190 crore with CAGR of 36.07%.
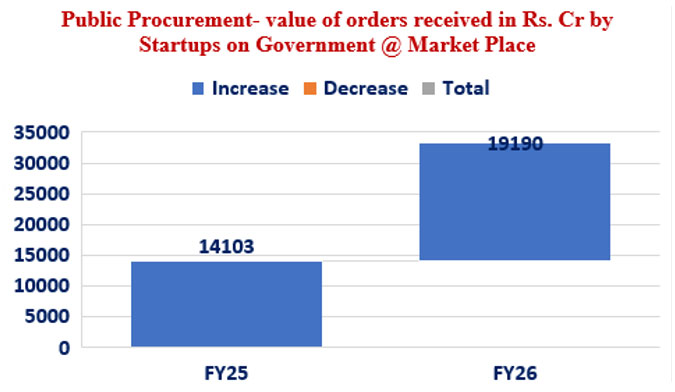
Source: DPIIT, Government of India.
Figure 8: Public Procurement
Figure 9 exposes Investment Enabled increase from Rs.980 crore to Rs.1039 crore and the CAGR is 6.02%.
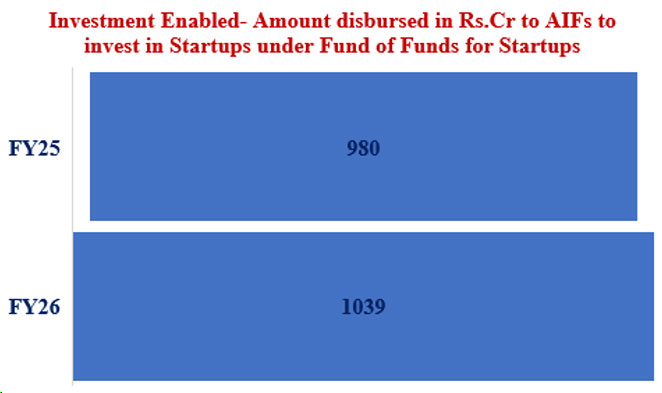
Source: DPIIT, Government of India.
Figure 9: Investment Enabled
The CAGR of all the variables are given in figure 10.
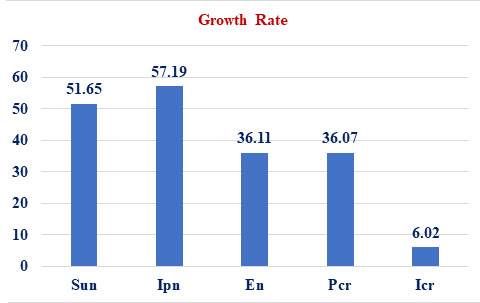
Source: Computed Data
Figure 10: Growth Rate
4.7 Prescriptive Analytics
Recommended Actions: Increase funding in Tier-2 & Tier-3 cities, Expand AI-driven startup ecosystems and Improve credit accessibility.
4.8 Decision Analysis
Policy Decision Matrix: The decision analysis is given in table 6.
| Table 6: Decision Analysis | ||
| Strategy | Impact | Priority |
| Expand CGSS | High | Immediate |
| Increase FFS funding | High | Immediate |
| Regional incentives | Medium | Short-term |
| AI integration | Very High | Strategic |
Source: Computed Data
5. Findings, Suggestions and Conclusion
5.1 Findings
Startup ecosystem shows exponential growth trend. Policy interventions have high effectiveness. Strong link between investment and innovation output. Employment generation is rapidly increasing. Regional imbalance persists. Predictive analysis indicates continued high growth.
5.2. Suggestions
Develop AI + Robotics startup clusters (specially manufacturing hubs like Chennai). Strengthen state-level innovation ecosystems. Expand credit guarantee schemes further. Promote export-oriented startups. Increase R&D incentives and patent support and Implement data-driven policy monitoring systems.
5.3. Conclusion
The Startup India initiative has successfully created a robust entrepreneurial ecosystem over the past decade. Business analytics confirms that policy interventions have played a decisive role in driving startup growth, innovation, and employment.
Future success depends on: Technology integration (AI, ML, robotics). Regional inclusivity and Scalable financial support systems. India is well-positioned to become a global startup powerhouse if data-driven policymaking continues.
6. References
Disclaimer : The opinions expressed within this interview are the personal opinions of the interviewee. The facts and opinions appearing in the answers do not reflect the views of Indiastat or the interviewer. Indiastat does not hold any responsibility or liability for the same.
... Read more